
A Global Map of Fields for Real-World Use
In much of the world, we don’t have reliable maps of individual farm fields. We know where crops are grown, but not where one field ends and another begins. These field boundaries, or the outlines of individual field farm fields, are the unit used to estimate yields, plan inputs, track water use, and assess risk. In many parts of the world, those boundaries have never been mapped consistently, limiting how agriculture can be measured and managed.
The Fields of The World (FTW) project set out to address that gap. Developed by a global team including Taylor Geospatial, NASA Harvest, Microsoft AI for Good Lab, and academic partners including Arizona State University, Washington University in St. Louis, and Clark University, FTW began as a benchmark dataset designed to train models that could map field boundaries across different farming systems.
That work has now led to a new release: the first global agricultural field boundary map at 10m resolution. The dataset covers 2024 and 2025, and includes more than 3 billion mapped field units across 241 countries and territories, derived from Sentinel-2 satellite imagery. The online platform also allows users to generate field boundaries using recent Sentinel-2 imagery. Its versatility across regions results from a diverse training dataset. Earlier versions of FTW included over 1.6 million labeled fields across 24 countries, capturing variation in field size, shape, and landscape structure. Many field boundary models work well only in the regions where they are trained. That diversity made it possible to train models that perform more consistently across very different agricultural systems.
The Fields of the World Explorer App allows users to view agricultural fields around the world. This GIF zooms into an agrarian community outside Jodhpur, India, showing individual field boundaries. In the global view, purple indicates a lower density of fields while green indicates a higher density. In the local view, yellow fields have lower predictive confidence and green indicate higher confidence.
The map is only one part of the new system. The FTW Explorer App allows users to draw an area, run field boundary detection, and download results. An API and command line tool allow for larger workflows and a QGIS plugin allows users to bring these outputs into an environment many already use for geospatial analysis. These tools are designed to make field level mapping more accessible to researchers, governments, and organizations that may not have the resources to build these systems from scratch.
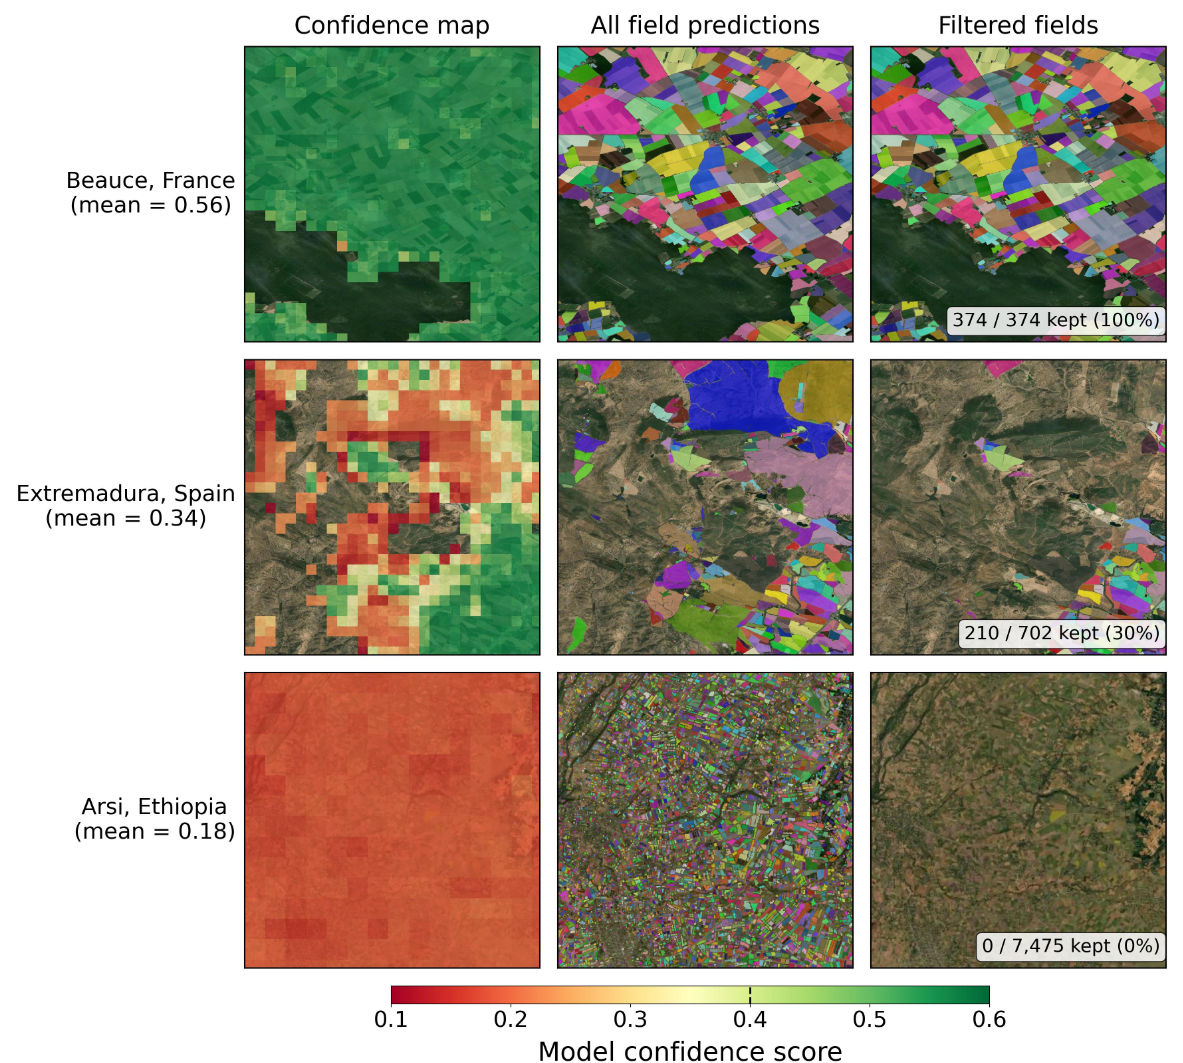
Examples of Fields of the World field boundary predictions across regions with different confidence levels. The left column shows the model confidence layer, where green indicates higher confidence and red indicates lower confidence. The middle column shows all field boundaries predicted by the model, while the right column shows the predictions that remain after lower confidence detections are filtered out. Locations in France, Spain, and Ethiopia were selected to represent regions with high, medium, and low average confidence scores. As confidence decreases, fewer predicted fields are retained after filtering.
Those tools make the data easier to use, but they also don’t remove its limits. For instance, the dataset focuses on annual field crops and does not capture all types of agriculture. Additionally, the mapped units come from satellite imagery, not surveyed boundaries. In reality, a single field can be split into multiple polygons, or neighboring fields may be merged. Earth observation satellites can struggle to fully differentiate these details. To account for these uncertainties, the release includes confidence layers, allowing users to adjust how conservative or inclusive the results are. In practice, this means users can tune the outputs depending on whether they prioritize higher precision or broader coverage.
Despite these limitations, the release of FTW means that field boundaries now exist at a global scale and can be used without building models from scratch. This opens up field-level analysis in places where it was previously not possible, from estimating production in data-scarce regions to comparing agricultural systems across countries using a common framework.
Field boundaries have long been a missing layer in global agriculture. This release does not resolve every uncertainty, but it makes field-level data available where it was previously missing.
Visit the Fields of the World website and Explorer app to learn more.