
Launch of Updated Harvest2Market Agricultural Supply Chains Monitoring Tool
As global food systems are exceedingly interconnected, local agricultural disruptions whether from drought, conflict or policy shifts can ripple across markets and countries. Tracing how local crop conditions influence international trade flows remains a challenge. That is why NASA Harvest developed Harvest2Market, web-based platform which integrates satellite-derived Earth observation data with trade, market, and economic indicators, enabling users to visualize and analyze the multifaceted pathways of the global agricultural supply chain.
Developed with support from the Famine Early Warning Systems Network (FEWS NET), Harvest2Market exemplifies the kind of cross-sectoral collaboration needed to track and respond to food security threats. By merging insights from Earth science, economics, and agrifood system monitoring, the tool provides a connected view of how weather, production, trade, and policy intersect.

More than just a data viewer, Harvest2Market contextualizes production and trade dependencies, empowering decision-makers to see how shifts in crop conditions can ripple through markets and impact food security worldwide. Harvest2Market is designed to ease accessibility and improve transparency of the dynamic connections within the global agricultural supply chain. By bringing together Earth Observation (EO) data with supply chain indicators, the platform enables users to explore the relationship between crop production, trade dependencies, and food security.
Application Features
Open Access Dashboard
Freely available at harvest2market.nasaharvest.org, the platform offers intuitive access to key datasets.Global Insights
Includes 36 visualizations that capture the broader landscape of global agriculture, from trade flows to production trends.Country Insights
Over 100 country-specific pages offer localized insights, each with up to 16 tailored visualizations that span crop conditions, vulnerability indices, and more. These insights foster better coordination between national and international actors responding to regional food supply risks.Crop Monitor Events - highlighting drivers between reports
Customizable Layouts
A flexible, card-based interface allows users to organize, resize, filter, and export data views to suit specific analytical needs.Grouped Data Cards
Related datasets are visually grouped to help users follow the logic of complex scenarios—e.g., trade wars, crop failures, and market shocks—encouraging sector-spanning analyses.
Data Sources
Harvest2Market features data produced by NASA Harvest, partner organizations, and publicly available datasets. Key datasets include:
GEOGLAM Crop Monitor Crop Conditions
Crop Monitor Events (highlighting drivers between reports)
Agrometeorological Indicators
FEWS NET Data Warehouse
A novel Multi-Regional Input-Output (MRIO) model for agricultural industry connectivity analysis (using IMPLAN and GTAP data)
Trade Dependence and Vulnerability Indices (IFPRI)
Agricultural Market Information System (AMIS) Market Database
Examples of Harvest2Market Use Cases:
1) Country Insights in action:
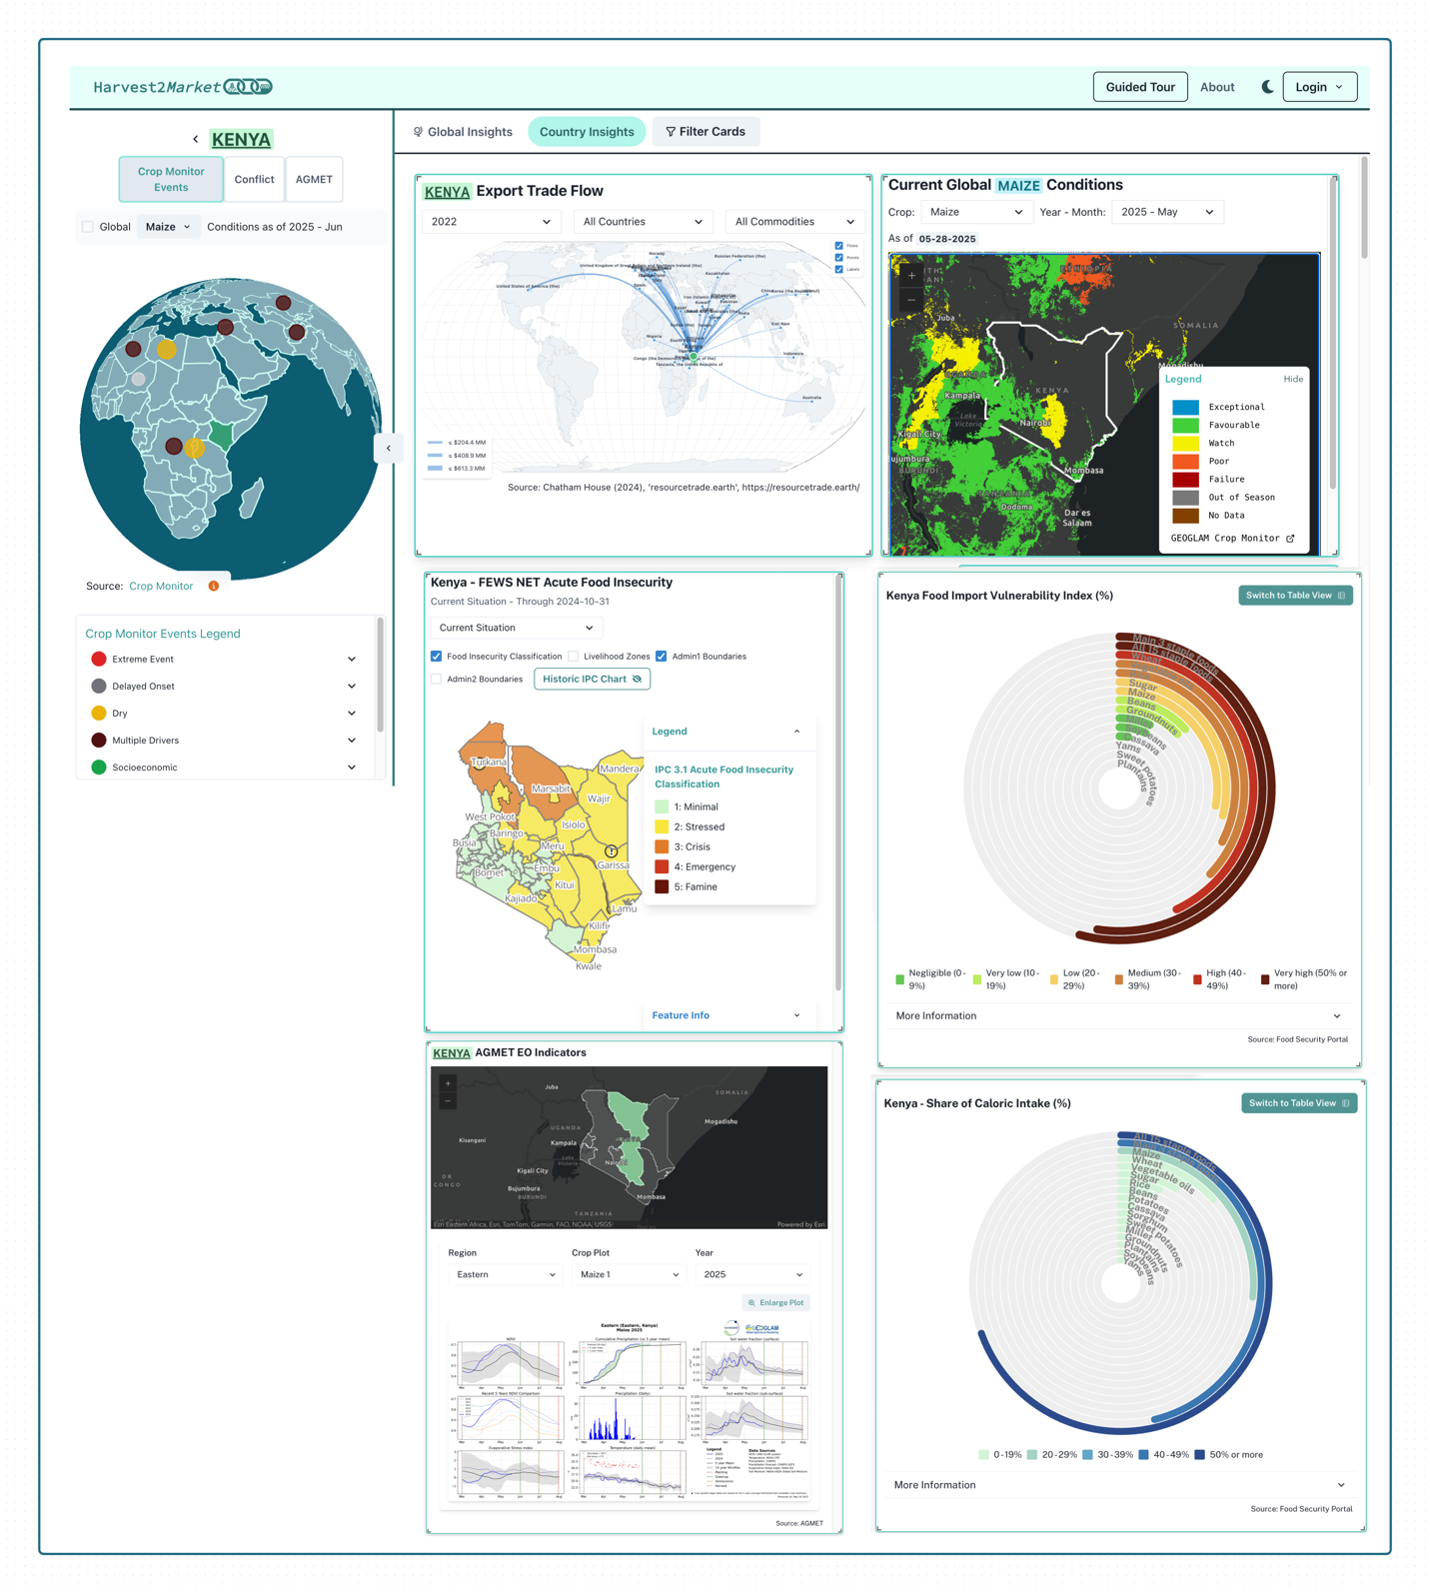
Kenya’s insights page illustrates country-level data which includes trade flows, crop conditions, agrometeorological indicators, trade dependence and vulnerability indices. This type of information helps support FEWS NET analysts, local governments, and NGOs alike in proactive decision-making.
2) Global Trade Insights:

Spotting Early Warning Signs
In November 2024, Argentina’s wheat fields in the north showed signs of stress (“Poor” or “Watch”), flagging potential impacts on global wheat supply.
Understanding Trade Dependence
Countries like Nigeria (100% dependent on wheat imports) and Brazil (46%) are particularly exposed to disruptions from key suppliers such as Argentina, highlighting the importance of monitoring international supply chain links.
3) Shifting Trade Patterns:
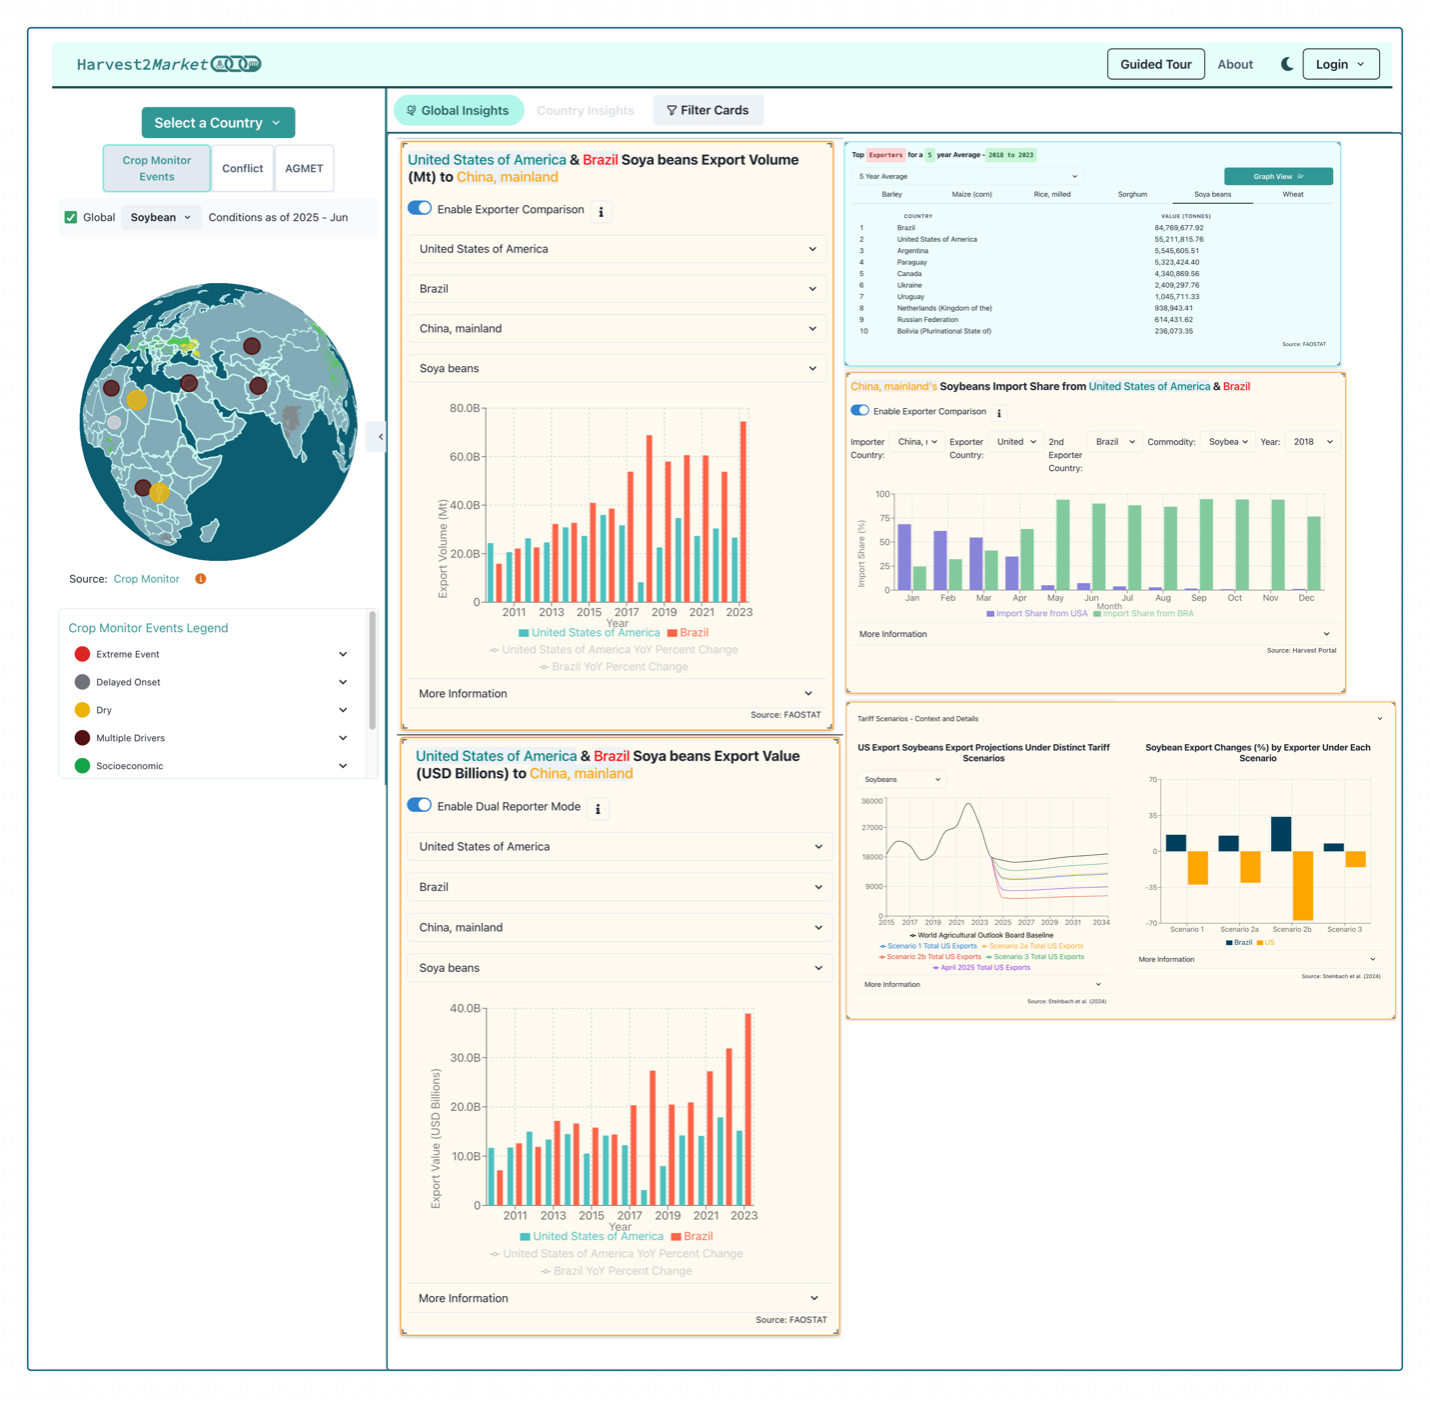
Visualizing Policy Impact
China’s retaliatory tariffs on U.S. soybeans in 2018 led to a sharp decline in U.S. exports and a concurrent rise in shipments from Brazil. This is reflected in the charts included under “US-China Trade War 2018” data view.
Tracking Shifts in Supply Chains
Harvest2Market helps users explore how changing prices, production levels, or policy shocks can prompt new trade relationships, revealing how exporters adjust to meet emerging global demands.
By making the often-invisible flows of agricultural production, trade, and food supply more visible and understandable, Harvest2Market helps researchers, policymakers, and humanitarian organizations make better-informed decisions that can strengthen global food systems. As challenges like severe weather events, conflict and war, and market volatility continue to threaten agricultural supply chains, tools like Harvest2Market—developed through international partnerships and with support from FEWS NET—will be critical in building a more resilient, transparent, and interconnected future for food security worldwide.