
NASA Acres Study Reveals Tillage Trends in Kansas
A new study led by NASA Acres and the Harvest Sustainable and Regenerative Initiative researchers at the University of Maryland together with collaborators from Kansas State University has shed new light on how farmers across central Kansas manage their soils and how satellites can help track those changes. The research, published in the International Journal of Applied Earth Observation and Geoinformation, analyzed more than a decade of windshield survey data to understand how often farmers switch between conventional (high-intensity tillage) and conservation (low-intensity) tillage practices, and how accurately satellite imagery can detect those shifts.
“This study is a perfect example of how NASA Acres connects science to real-world agricultural management,” said Alyssa Whitcraft, Executive Director of NASA Acres. “By pairing satellite observations with field data, we can better understand farming practices that impact both productivity and sustainability.”
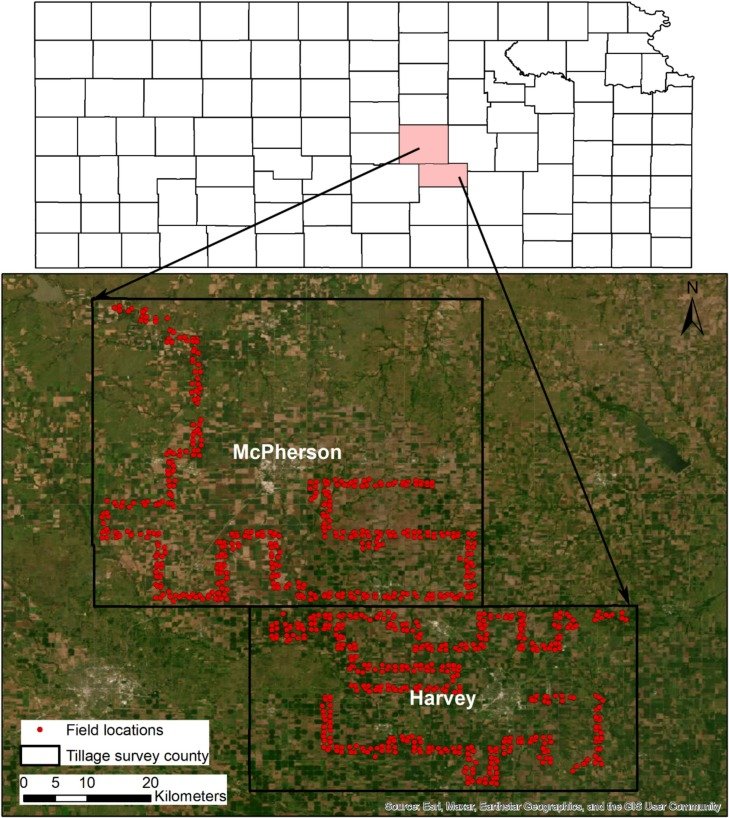
During the 11 year period of the study, 249 fields were visited 10 times, 465 fields were visited 11 times, and 307 fields were only visited once. This map shows the distribution of visited fields in McPherson and Harvey counties in Kansas.
Tillage, the way farmers loosen or turn the soil before planting, affects soil health and organic matter (carbon storage). “Low-intensity” conservation tillage keeps crop residue on the surface where it helps protect against erosion and soil moisture loss. “High-intensity” conventional tillage involves deeper plowing and/or more complete residue removal, and is often used to manage weeds and reduce soil compaction. Many studies demonstrate that frequent high-intensity tillage can negatively impact soil health and ultimately productivity.
The View from the Land
The researchers combined two very different data sources: years of roadside surveys from more than 1,200 fields across McPherson and Harvey counties and imagery from the Harmonized Landsat-Sentinel (HLS) collection. HLS merges data from NASA’s Landsat and the European Space Agency’s Sentinel-2 missions. Using machine learning, they tested how well those satellite observations could identify how intensively each field was tilled.
Based on windshield surveys collected by Kansas agronomists between 2011 - 2022, the team found that low-intensity tillage became more commonly used across the region. Even so, around 16% of fields switched back to high-intensity tillage each year, and many farmers changed their methods every few seasons. The impacts of these practices on soil health in the surveyed fields was beyond the scope of this study, but merits further and future collaboration to understand how large of an effect these adoption and dis-adoption dynamics have on long-term productivity, soil fertility, water use, carbon storage, and more.
The View from Space
The study’s lead author Dr. Guanyuan Shuai then used this unique ground dataset to further evaluate the capabilities of satellites to map tillage dynamics in new areas where ground datasets do not exist. He used a Random Forest model to analyze a number of satellite-derived vegetation and soil indicators. To reduce computational requirements, Dr. Shuai created composites of satellite imagery during the crop’s off season, approximately November-May for summer crops like corn and May-October for winter crops like winter wheat. This allowed the model to more easily compare the amount of residue left on the fields and determine the type of tillage used.
Unlike earlier studies that looked at a single crop, the NASA Acres team examined multiple crop types. This added more complexity to mapping, but is a methodological necessity to yield a clearer picture of how tillage decisions change over time. Their findings suggest that future models and studies should include intermittent tillage to better understand its long-term influence on soil carbon and productivity.
“This work shows that satellite data can track how farmers manage their fields with surprising precision when it's matched with field data,” said Ritvik Sahajpal, Climate Risk Assessments Co-Lead for NASA Harvest and Project Lead at NASA Acres. “It's an encouraging step toward monitoring soil management in a consistent way over much larger areas.”
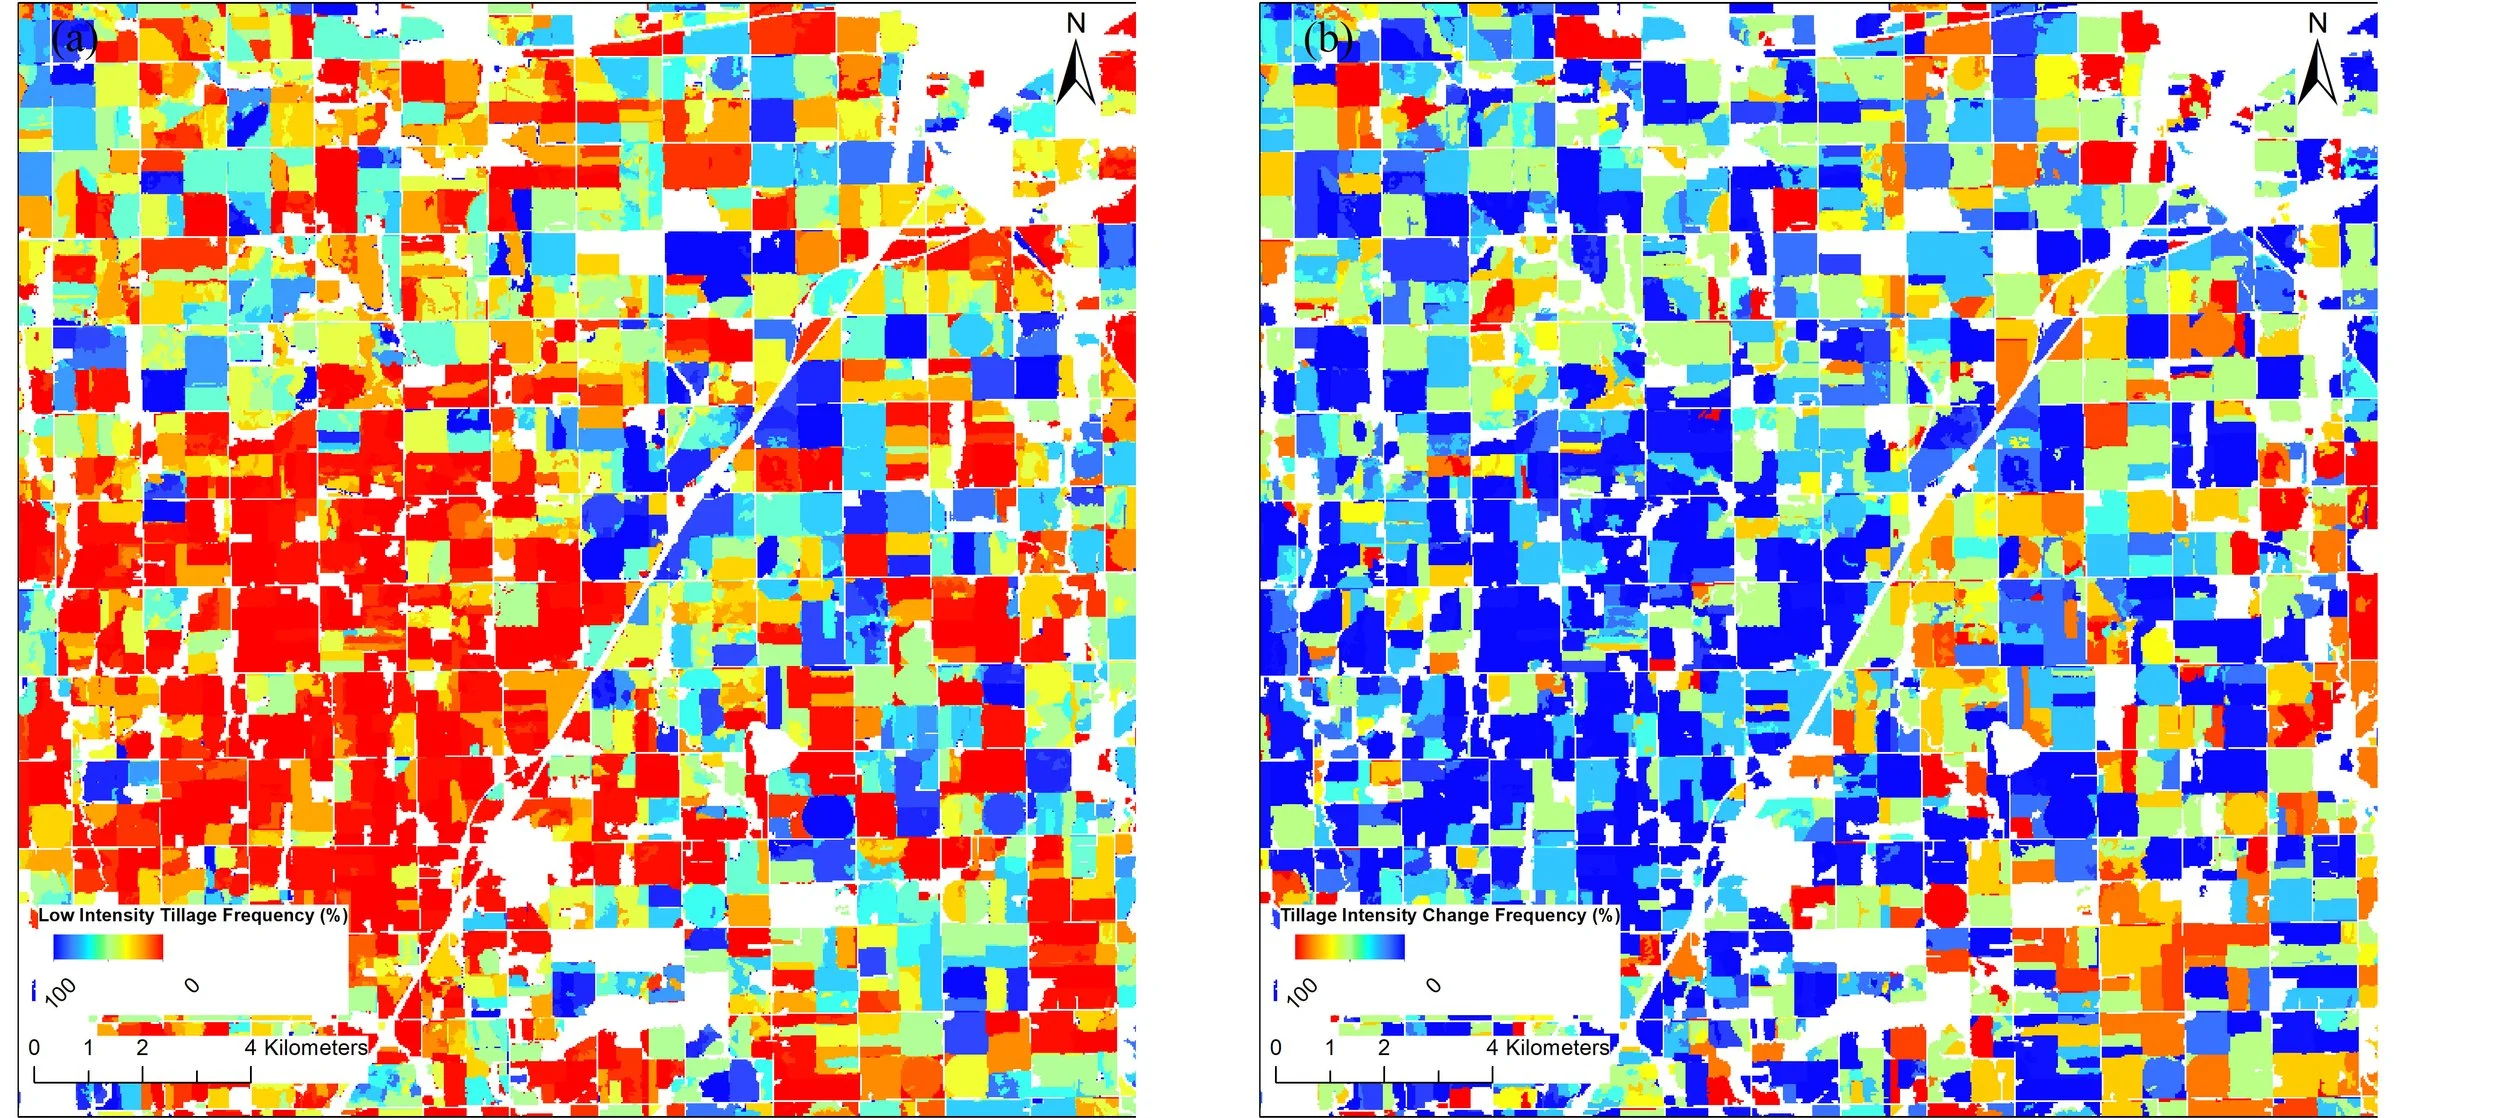
These maps show tillage patterns during the study period. The left map indicates the percentage that a given field used low intensity tillage during the study period, while the right map indicates how frequently the given field changed from low- to high-intensity or high- to low-intensity tillage during the study period.
From this, we can see that many of the fields in the SW corner of the study area (on the left map) remained high-intensity tillage during the entirety of the study. Likewise, we can see that a small number of fields (those in blue scattered across the study area in the left map) stayed low-intensity tillage during the entirety of the study period.
And in the right map, the red fields changed with 100% frequency, meaning that those fields changed annually during the study period. Blue fields in this map did not change tillage intensity year to year.
Looking Over Time Reveals Important Dynamics
For managers and policymakers, the study shows how measuring conservation progress by adoption rates alone can hide important details. Low intensity tillage increased overall in both counties, yet many fields returned to more intensive practices at some point during the study. This cycle, known as intermittent tillage, shows how farmers shift between conservation and conventional approaches depending on conditions and management needs. Switching tillage intensity can reduce the long-term soil health and carbon storage gains that come from staying with conservation tillage year after year.
Part of the reason for these shifts lies in how farmers rotate crops between years. Farmers in the study typically rotate wheat, soybeans, and corn in repeating patterns. The team’s analysis found high- and low-intensity tillage occurred in 58% and 42%, respectively, of fields that had most recently harvested corn, 35% and 65% of fields that had most recently harvested soybeans, and 72% and 28% of fields that had most recently harvested wheat, respectively. Low-intensity tillage tended to follow soybeans, which leave less residue behind. In contrast, wheat and corn both leave more residue.
While residue plays an important function as previously noted, and can also provide an additional revenue source where incentives are available for reducing tillage, residue build up after several years of low-intensity tillage can make weeds and diseases tougher to control. At first, chemicals can help, but after a few years pests and disease can adapt. When that happens, some farmers decide to plow more deeply again. The cycle starts over, and it becomes hard to gauge environmental benefits just from adoption statistics.
Moving Forward
The authors say future research should represent intermittent tillage more accurately because it mirrors how farmers actually work their land. As carbon markets and conservation programs rely more heavily on satellite verification, the way tillage data are labeled and collected - specifically, whether they are correspondent with human vision and qualitative descriptions - will matter even more.
Future research should develop cross-disciplinary surveys that include farmers, agronomists, and satellite specialists. It should also add quantitative residue measurements across multiple crop types to field surveys coincident with satellite overpass to develop stronger correlations between what the satellite sees and what is on the ground.
“By combining years of ground surveys with satellite observations, we can finally see how soil management changes across entire landscapes,” said Dr. Shuai. “It’s a big step toward tracking how farming choices affect both yields and the climate.”
The team plans to extend this work beyond Kansas to map tillage dynamics across the country. Their approach provides a practical framework for satellite-based monitoring that can help scientists, policymakers, and farmers understand what’s happening below the surface and how those choices shape the land and environment.