
NASA Harvest and Agmatix Collaboration Produces New Models to Monitor Crop Growth Stage and Crop Cycles
Satellites can tell us more about a field than whether it is green or bare. By tracing how vegetation changes over time, repeated observations can reveal when crops begin growing, when they reach their seasonal peak, when crop senescence begins, and the number of crops grown in the same field over the course of a year. Two new open source models developed through the NASA Harvest and Agmatix collaboration use these changes in vegetation over time to estimate crop growth stages and identify cropping cycles using satellite data.
These models are based on how satellites observe vegetation. Sensors aboard satellites such as the European Space Agency’s Sentinel-2 and NASA’s Landsat measure reflected energy across several parts of the electromagnetic spectrum, including wavelengths beyond what the human eye can see. Healthy vegetation absorbs much of the red light that reaches it while reflecting strongly in the near infrared. Vegetation indices use those differences in reflectance to describe plant conditions. One of the most widely used is the Normalized Difference Vegetation Index, or NDVI, which compares red and near infrared reflectance to estimate how green and photosynthetically active vegetation is.
A single NDVI value can only tell us the situation at a specific location and moment. When scientists create a series of NDVI values, however, they can see how it changes over time. As a crop develops, NDVI typically rises during an initial stage called green up, reaches a seasonal high as vegetation becomes denser, and then falls as the crop senesces and the field moves toward harvest or bare soil. That recurring rise and fall pattern gives the two models a way to interpret both where a crop is within a season and how many distinct growing seasons occurred over a longer period.
Crop Stage Detection Model
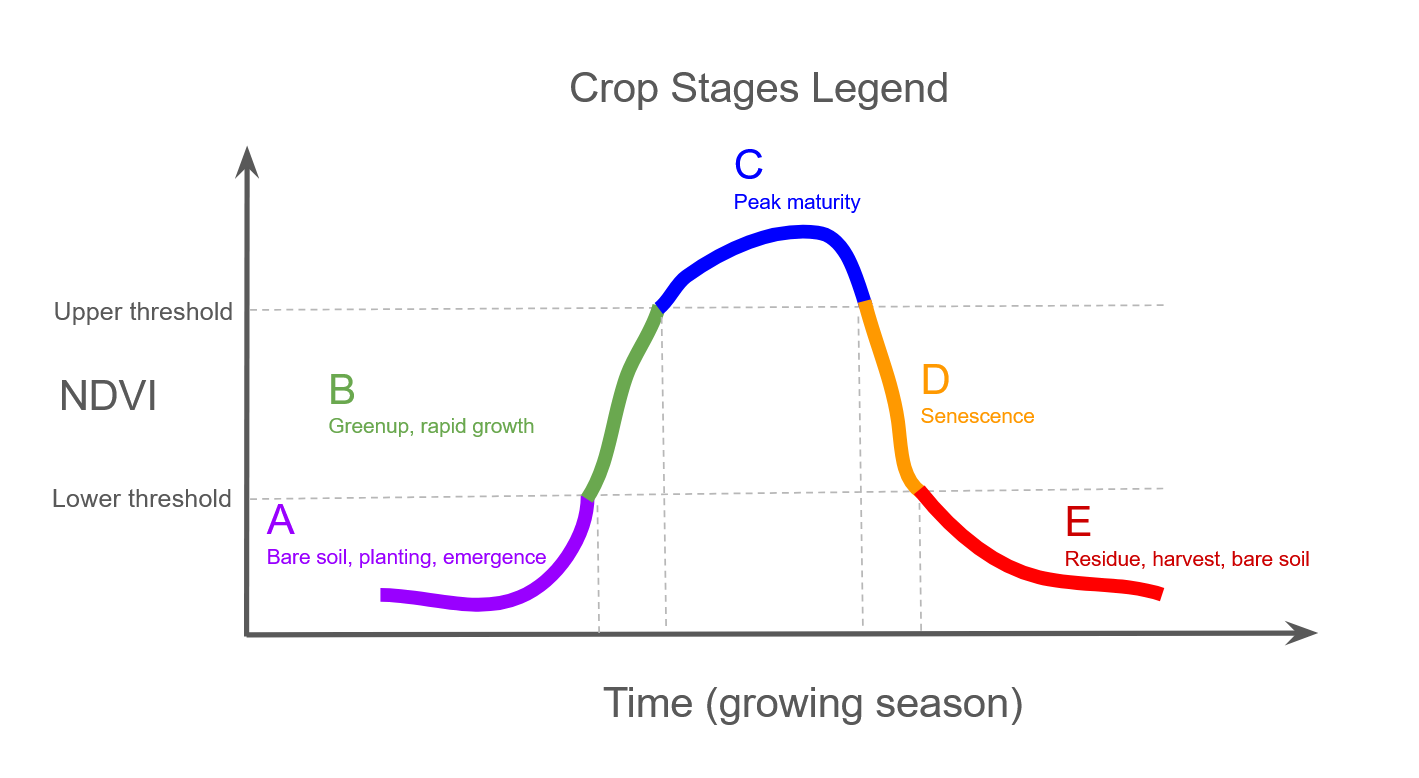
The model divides a typical seasonal NDVI curve into five broad stages, from bare soil, planting, and emergence through rapid growth, peak maturity, senescence, and post-harvest conditions.
The first model focuses on that first question: what is the current crop stage of a field? It evaluates the latest observation in an NDVI time series and assigns one of five broad stages, ranging from bare soil, planting, or emergence through rapid green up, peak maturity, senescence, and post harvest conditions. The model can retrieve NDVI observations from Sentinel-2 and Landsat through Google Earth Engine or users can provide their own tabular NDVI data.
Because the model is crop agnostic, it does not require a separate calibration for each crop type. Instead, it compares the latest observation with the field’s own seasonal NDVI pattern, using the NDVI value, whether it is rising or falling, and whether a seasonal peak has already been confirmed. That allows the same framework to be applied across different row crops and vegetables, even when their growing seasons differ in timing or intensity.
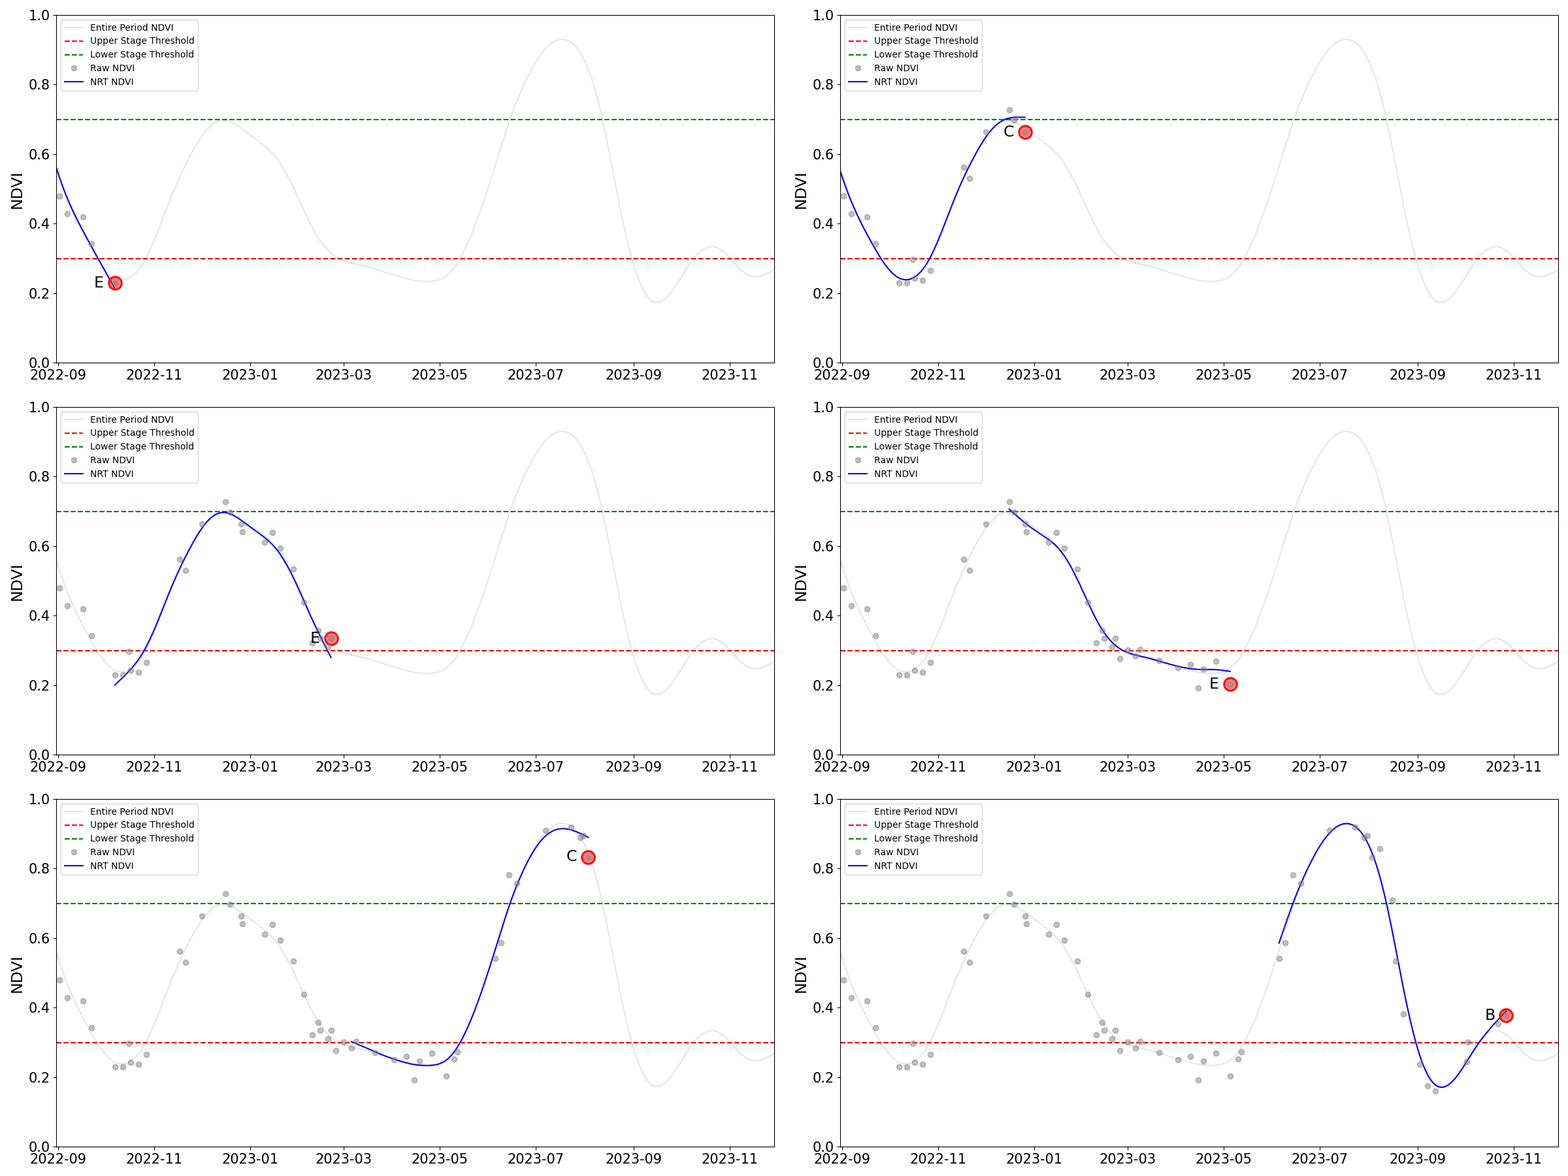
The Crop Stage Detection model follows changes in NDVI over time and estimates the crop stage for the latest observation. This animation shows the estimate changing as the model moves through an example NDVI time series.
Crop Cycle Detection Model
The second model looks at the same kind of NDVI time series over a longer period. Rather than estimating the field’s current growth stage, it identifies repeated seasonal peaks and troughs to separate one cropping cycle from the next. For each detected cycle, it estimates the approximate season start and end, green up date, peak NDVI date, and season length. A multi-year record can therefore show whether a field went through one crop cycle, several cycles, or periods when no complete growing season was detected.
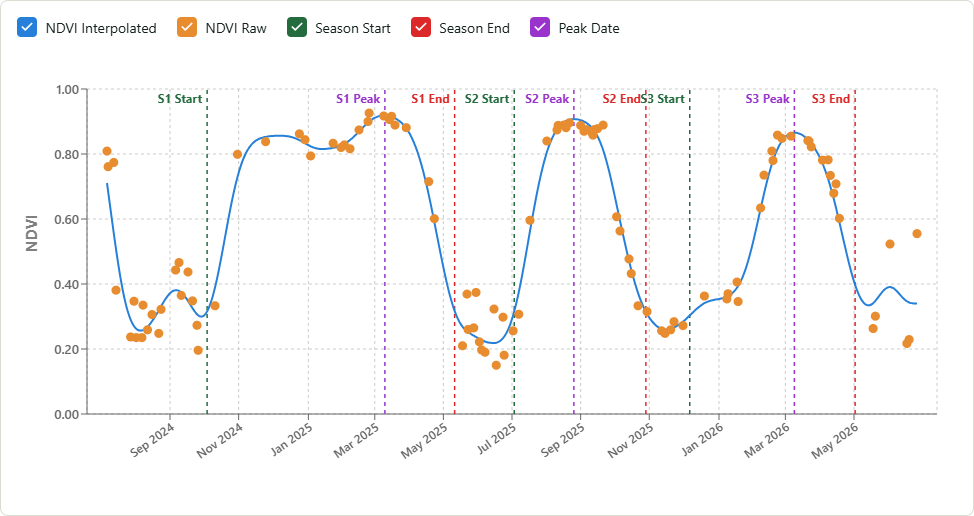
The Crop Cycle Detection model analyzes changes in NDVI over time to identify individual growing seasons. In this example, the model detects three cropping cycles and estimates the start, peak, and end of each season. Orange points show the raw NDVI observations, while the blue line shows the processed, interpolated time series used by the model.
How the Models are Being Applied
The models are already being tested and applied in North Carolina. The Crop Stage Detection model is being used as part of a near-real-time harvest detection workflow for corn and soybean fields. Because harvest detection models require considerably more computing power, the lighter-weight crop stage model serves as an initial screening step, identifying when a field has reached the portion of its NDVI curve where harvest is expected before the more computationally intensive model is run.
The Crop Cycle Detection model has also been applied across approximately 53,000 fields statewide. Researchers used the resulting information on the number and timing of cropping cycles to characterize individual fields, then aggregated those results by county to examine broader patterns in cropping intensity and seasonal field use. The same type of information could also support other applications, such as updating crop calendars with more recent estimates of season start and end dates or filling gaps where cropping season information is unavailable.
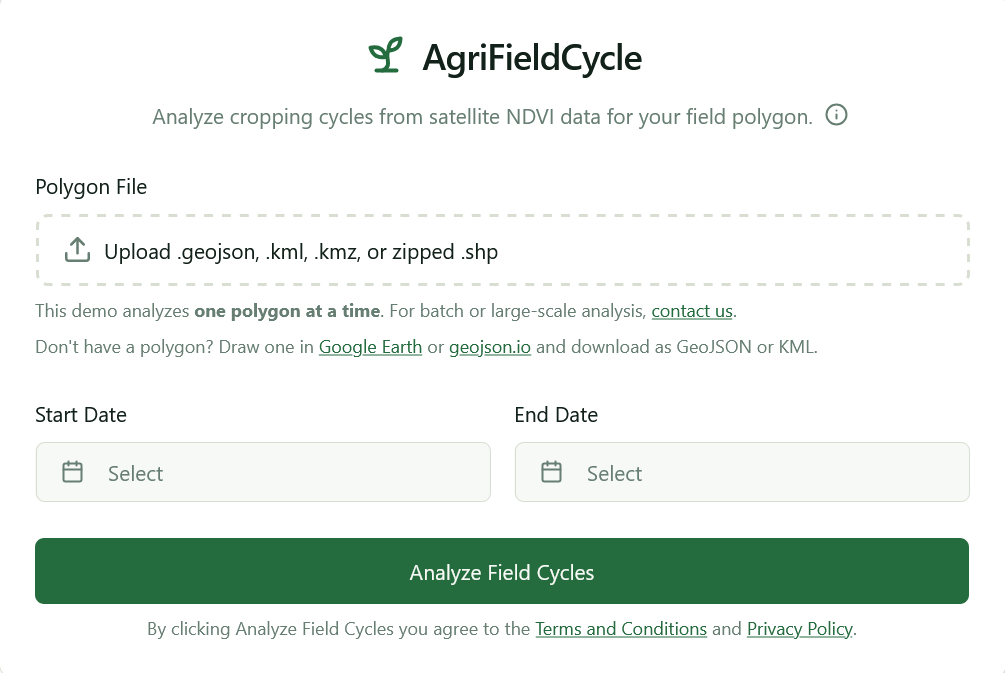
The Crop Cycle Detection model is available through this newly released web app. Users can upload the boundaries of their study area and the start and end dates of their study period and receive an NDVI time series like seen in the above image.
Outputs from both models are also being incorporated into Agmatix’s Axiom platform, where they add field level information on crop development, seasonality, and cropping intensity to a broader agricultural data knowledge base.
How are the Models Available
Both models are available as open source Python tools through NASA Harvest’s GitHub, with additional options designed to make them easier to use. The Crop Stage Detection repository includes a Google Earth Engine script that lets users work directly with Sentinel-2 and Landsat observations, while the Crop Cycle Detection model is also available through a newly released web app. Together, these entry points make the models accessible to users who want a more guided workflow, while keeping the underlying code available for researchers and developers who want to work with or adapt the methods directly.
About Agmatix and the collaboration with NASA Harvest.
Agmatix and NASA Harvest are collaborating to use remote sensing to monitor field activities and sustainability outcomes across cropping systems at scale. Agmatix, a GrowersTech company, developed AXIOM™, a neuro-symbolic AI engine built for the agri-food industry.