
A New UN Handbook Sets Standards for Remote Sensing in Agricultural Statistics
A new Handbook on Remote Sensing for Agricultural Statistics has been released by the United Nations. NASA Harvest is pleased to have contributed to this effort and to share it with our community. The handbook speaks directly to a problem we work on every day: how to turn satellite data into numbers that governments can actually use. As climate shocks, conflict, and survey costs disrupt traditional surveys, reliable crop data has become harder to produce at the same time it has become more important.

Satellite radar imagery shows how sunflower fields reflect signals differently from maize fields in Ukraine. Because sunflower heads typically face east, they create a distinct directional pattern in the radar data. This difference, visible in the descending satellite overpass direction, helps distinguish sunflower from other crops when field surveys are not possible.
Satellite imagery is widely available, but many satellite-based estimates that look precise are difficult to evaluate or defend. Maps are often treated as final answers despite potentially high uncertainty, even when they inform policy and trade decisions. The handbook aims to correct this by setting standards for how evidence should be produced and documented, alongside the tools used to generate it. Written for agencies responsible for official agricultural data, it aims to help countries move experimental use of satellite imagery toward routine, defensible statistics. Developed through collaboration across national statistics offices and research partners, it presents field-tested methods, real-world case studies, and guidance on reporting uncertainty. NASA Harvest contributed with a case study reflecting the operational challenges national systems face.
Our case study is described in Chapter 23 of the handbook and focuses on estimating how much land in Ukraine was planted with sunflower crops during the 2023 growing season for both Ukraine-controlled and Russian-occupied regions. War had made field surveys impossible, and official agricultural reporting had largely stopped. Sunflower is an important crop for Ukraine and for global food and oil markets, so knowing how much was planted mattered even when access on the ground was limited. NASA Harvest was interested in not just whether sunflowers could be seen from space, but whether satellite information could be turned into numbers that decision-makers could rely on.
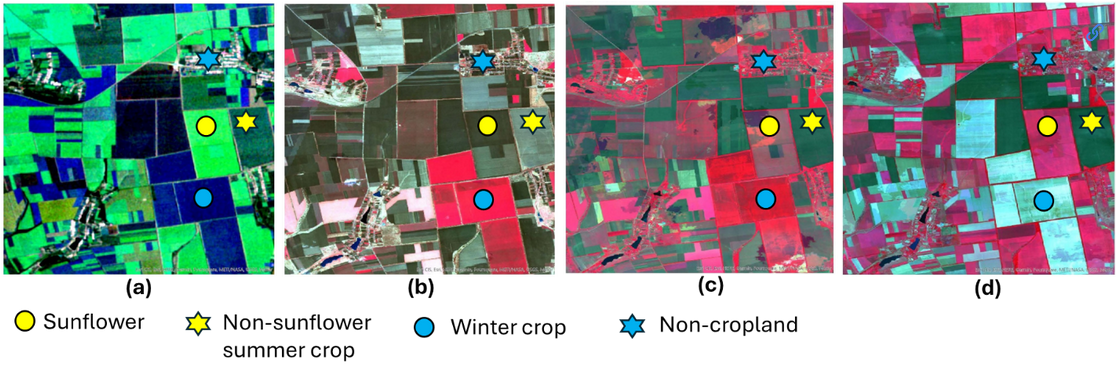
Seasonal satellite composites used to interpret sunflower and other crops. Panel (a) shows Sentinel-1 (radar) imagery, with colors representing median signal values from March–May (red), June–August (green), and September–November (blue). Panels (b–d) show Sentinel-2 (optical) imagery using near-infrared (red), red (green), and green (blue) bands. These images are displayed as bi-monthly median composites for March–April (b), May–June (c), and July–August (d), highlighting how crop signals change over the growing season.
Rather than treating satellite-based maps as final answers, the analysis treated them as a starting point. Satellite imagery (Sentinel-1 and Sentinel-2) from the European Copernicus program helped identify where sunflowers were likely growing, but the final results came from a careful statistical process. Sample locations were labeled at least twice by independent photo-interpreters, with disagreements reviewed, and those checks were used to calculate total planted area along with clear measures of uncertainty. The end product was not a refined map, but a set of area estimates that accounted for errors and limits in the data. The work also showed that this approach held up even when data quality differed across regions affected by conflict. The analysis was led by NASA Harvest’s Inbal Becker-Reshef, Sergii Skakun, Abdul Qadir, and Josef Wagner.
As Becker-Reshef, NASA Harvest’s Co-Director describes it, “The challenge isn’t producing a map. It’s being able to stand behind the number that comes from it, especially when conditions are far from ideal.” When uncertainty is measured and stated clearly, satellite data can support official statistics even in difficult settings. Without that discipline, numbers may look confident, but carry risks that are easy to overlook.
The handbook will not solve agricultural data challenges on its own. Its impact depends on whether countries are willing to adopt methods that are more transparent about their limits. That may mean accepting results that feel less clean than simple counts. But this kind of clarity helps countries judge when satellite data is strong enough to support decisions and when it is not, which becomes essential as uncertainty becomes a routine part of agricultural monitoring.